AppSuite provides the unified logging and monitoring solution your engineering team needs to maintain flawless performance and pinpoint issues instantly. Stop juggling tools, start controlling your data.
The Unified Data Platform
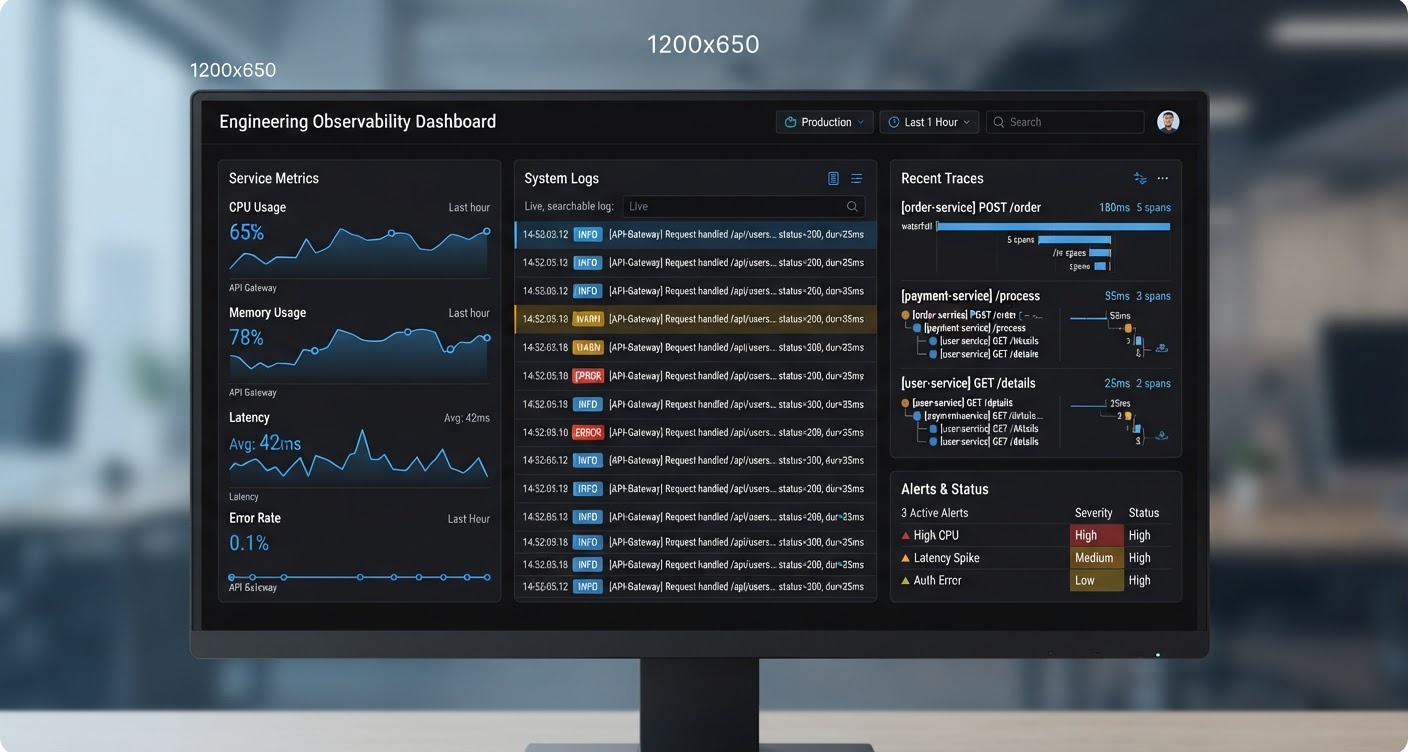
AppSuite consolidates three essential data streams into a single source of truth, offering unparalleled visibility and control over your application ecosystem.
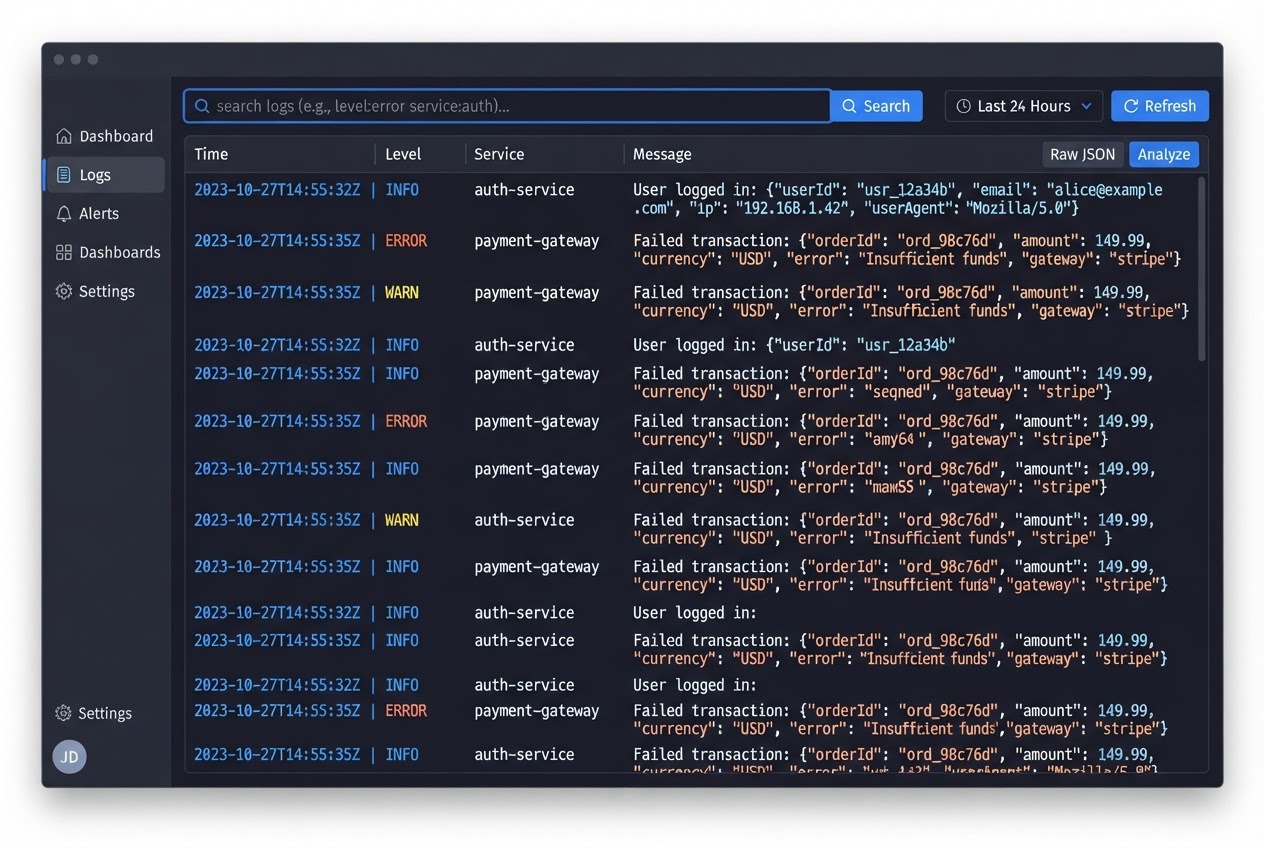
Stop scattering logs across different storage systems. Centralize application, infrastructure, and security logs with high-volume ingestion and lightning-fast search capabilities. Structure your data automatically for deeper insights.
Real-time log streaming and aggregation.
Contextual linking for related events and traces.
Advanced filtering and alerting straight from the logs.
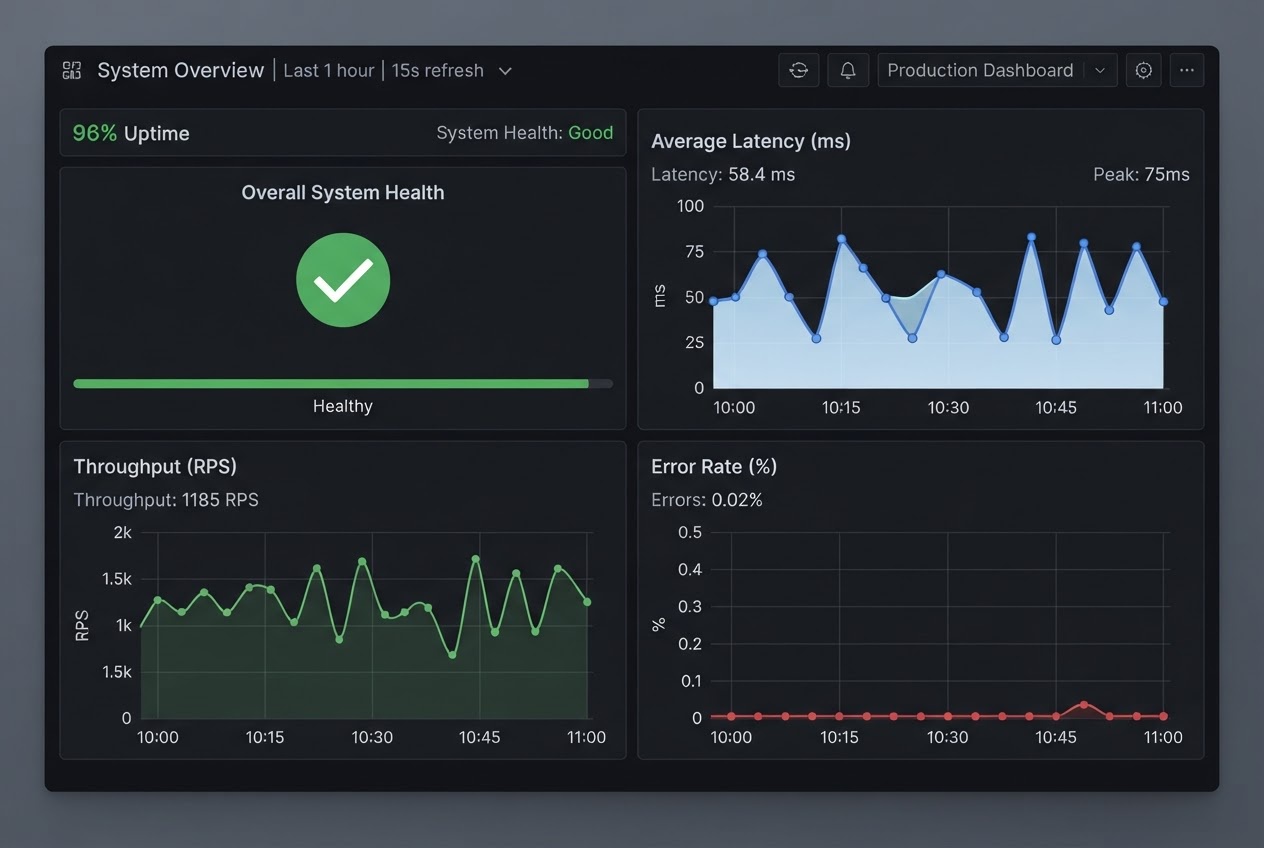
Track application and infrastructure health with precise, high-resolution metrics. Monitor everything from CPU utilization to custom business KPIs without sampling.
Customizable dashboards for operational visibility.
Automatic aggregation and anomaly detection.
Integrated data source compatibility (Prometheus, etc.).
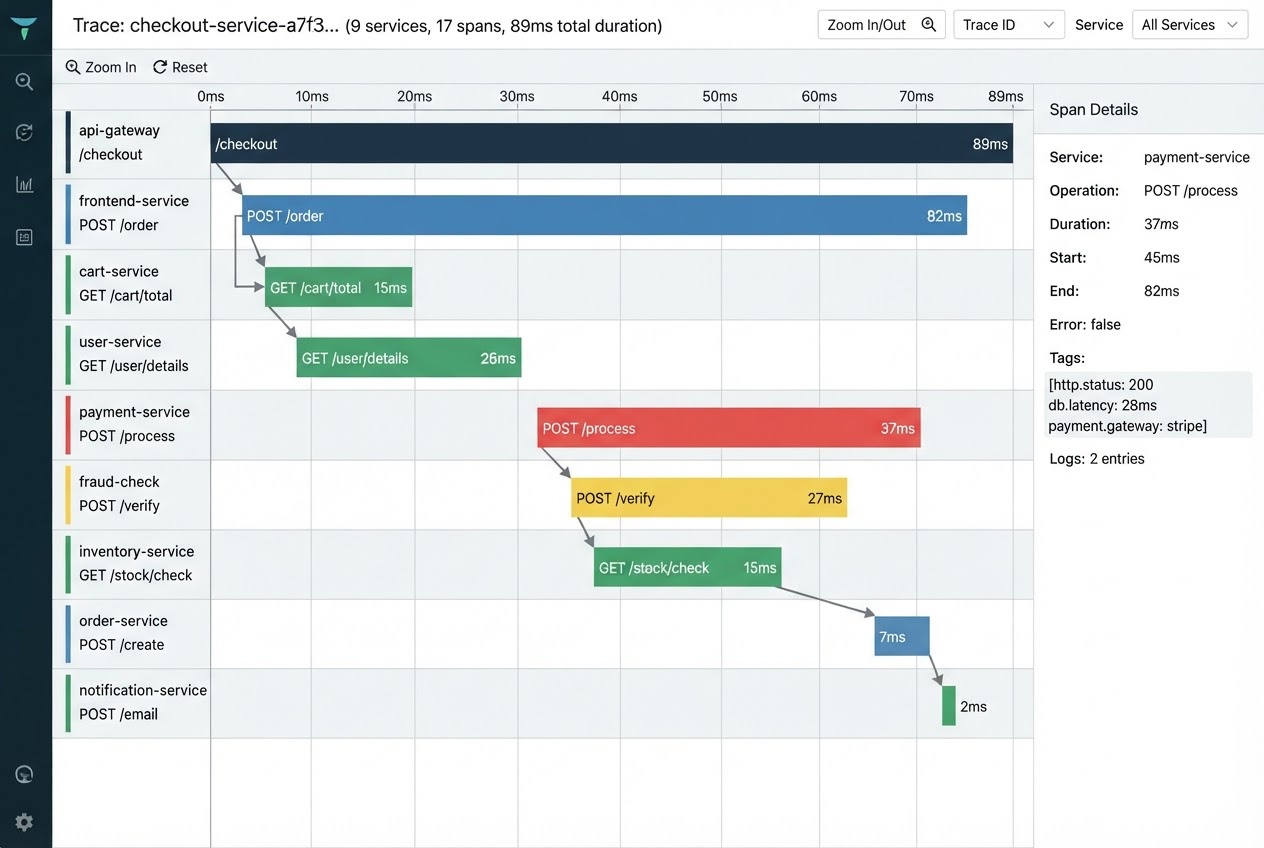
Dive deep into complex microservices architectures. Trace requests end-to-end, identify bottlenecks, and visualize service dependencies with detailed span data, reducing mean time to resolution (MTTR).
Visual service maps for dependency overview.
Root cause analysis linked directly to metrics and logs.
Support for OpenTelemetry standards.
The Path to Operational Excellence
AppSuite simplifies complex monitoring into three clear, actionable steps, transforming raw data into reliable outcomes.
Collect all your logs, metrics, and traces automatically via lightweight agents or standard protocols (OpenTelemetry). Data is centralized and standardized.
Use powerful search, machine learning, and correlation tools to automatically link logs, metrics, and traces to identify root causes and anomalies quickly.
Take immediate action based on intelligent alerts. Use historical data to optimize performance, prevent future outages, and ensure continuous reliability.
Visualize the Entire System State
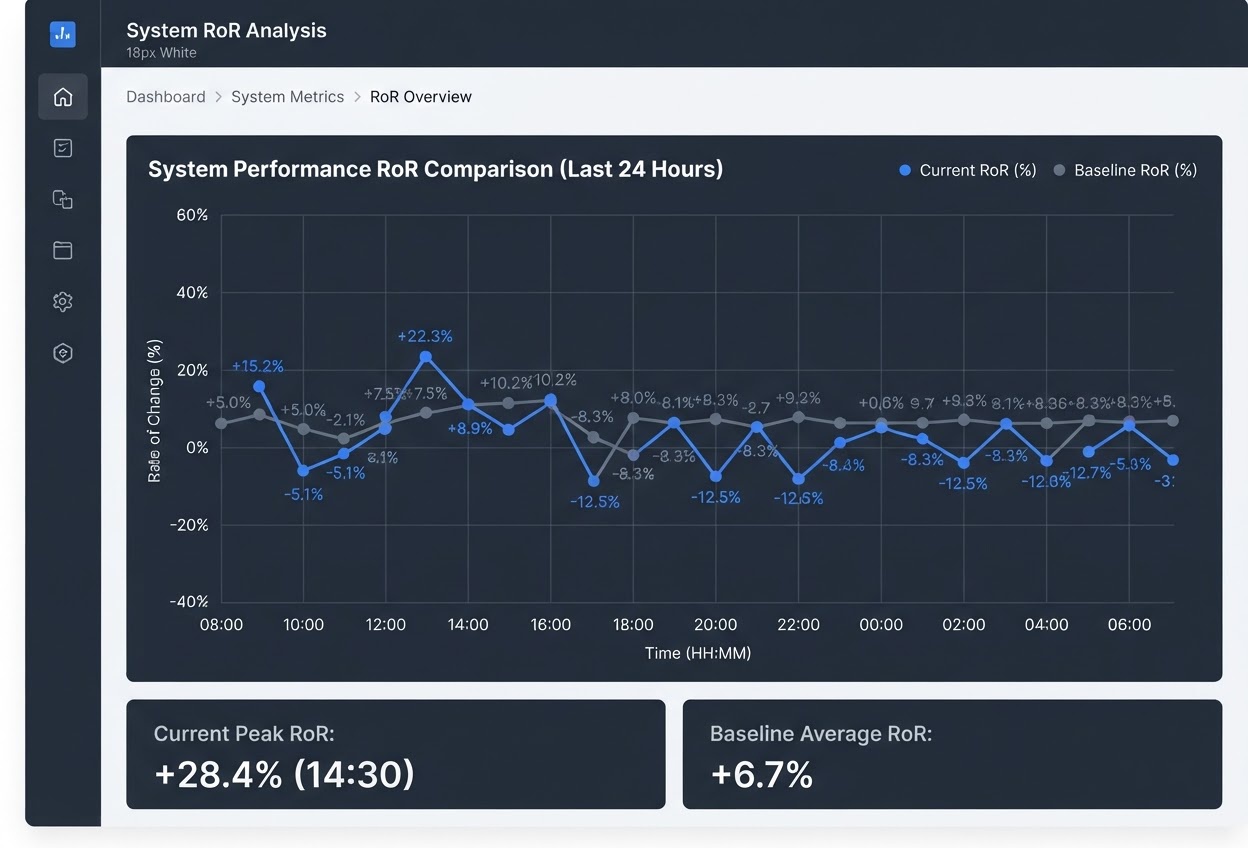
No more guessing games. AppSuite provides rich, context-aware visualization tools that help you instantly understand performance trends, compare different deployments, and diagnose the most subtle issues.
Easily overlay metric graphs from different time periods or deployments. Visualize the impact of your latest release directly against the previous version's performance baseline.
Seamless Dashboard Synchronization
View logs, traces, and metrics side-by-side with shared time ranges.
Performance Baseline Tracking
Automatically flag deviations from expected behavior with built-in ML.
What Our Users Say
"Before AppSuite, debugging was a nightmare of juggling three different tools. Now, everything is correlated automatically. We cut our mean time to resolution by 40% in the first month."
"The RoR comparison view is a game-changer for incident response. We can instantly see which deployment caused the latency spike just by overlaying the metric graphs. It's incredibly intuitive."
"The native support for distributed tracing using OpenTelemetry means integration was painless. We achieved full visibility across our microservices within a single afternoon. Highly recommended."
Scale Your Visibility as You Grow
Choose the plan that fits your current data volume and team size. Simple, transparent pricing with no hidden fees for features.
Ideal for small teams and personal projects.
50 GB Log Ingestion
30-Day Data Retention
Basic Metrics Monitoring
Community Support
For growing teams requiring deep observability.
200 GB Log Ingestion
90-Day Data Retention
Full Tracing and Metrics
Email and Chat Support
Root Cause Analysis Tools
For large organizations with compliance needs.
Unlimited Data Ingestion
Custom Data Retention (Up to 3 Years)
SLA and Dedicated Account Manager
Advanced Security Features (SSO, Audit Logs)
Stop reacting to problems and start predicting them. Try AppSuite free for 14 days—no credit card required.